The formal tests behind the findings, including the one whose assumption we question and why.
The eleven formal tests
Raw numbers can mislead in three ways: differences can arise from random variation in small samples, they can reflect citywide trends unrelated to cameras, or they can be artefacts of cameras being placed at unusually dangerous locations. These tests are built to separate genuine effects from those explanations. Where a test fails to do so, we say so.
| Test | What it asks | Result | p |
|---|---|---|---|
| 1. Injury risk ratio | Are collisions near cameras less likely to injure? | Lower near cameras | <0.001 |
| 2. Severity distribution | Does the whole severity profile shift? | Not significant | n.s. |
| 3. Chi-square, near vs far | Do near and far areas differ? | Picks up placement | n/a |
| 4. Per-camera paired (Wilcoxon) | Does each site improve against itself? | −10.2% median; 304 of 520 improved | 2.2 × 10⁻⁶ |
| 5. Camera departure | Do crashes rise when the camera leaves? | 62% of 383 sites rose | 2.58 × 10⁻¹⁰ |
| 6. Difference-in-differences | Injury odds vs the rest of the city | OR 0.920 | 2.3 × 10⁻⁵ |
| 7. Poisson, pooled | Camera vs non-camera sites | Wrong direction: placement | n/a |
| 8. Logistic with year FE | Injury odds with year controls | OR 0.951 | 0.005 |
| 9. Bootstrap resampling | Is the interval stable? | Interval stays below zero | n/a |
| 10. Staggered DiD (cohort) | Cohort-weighted within-site | −5.5% | n/a |
| 11. Callaway–Sant'Anna | Formal staggered estimator | +1% to +3% (assumption questioned) | n.s. |
Three of the eleven came out significant in the wrong direction. All three compare camera sites with other places, and inherit the fact that cameras went to the worst locations. The positive findings rest on within-site designs built to handle that selection.
Why we do not lean on Callaway–Sant'Anna
For staggered rollouts the econometrics literature recommends Callaway and Sant'Anna (2021), which compares sites whose camera has just arrived against sites whose camera has not yet arrived. We ran it on a balanced panel of 520 sites over 96 months, replicated in Python and Stata, and we report what it returns: an overall effect near zero. We do not build on it, for two reasons.
The identifying assumption. The estimator asks that sites without a camera yet be unaffected by cameras elsewhere. That holds when one state raises its minimum wage and the next does not. It is harder to sustain inside a single city, where drivers learn from signage, media coverage and tickets that the programme exists without knowing which intersection is live this month. If that awareness slowed drivers at sites still waiting for a camera, those sites are not clean controls and the estimator subtracts away part of the effect it is meant to measure.
| Year | Early-treated sites (had camera) | Late-treated sites (no camera yet) |
|---|---|---|
| 2019 | 100.0 | 100.0 |
| 2020 | 56.4 | 56.4 |
| 2021 | 55.0 | 54.1 |
The two groups declined by identical amounts even though only the early sites had cameras. That is consistent with cameras doing nothing, and equally consistent with the programme reaching both groups.
The mechanical reason. The panel codes treatment as absorbing, so once a site's first camera activates the site counts as treated in every later month even though the cameras rotated away within months. About three-quarters of the site-months it counts as treated had no camera on site. Since crashes rose again when cameras left, averaging over those months pulls the estimate toward zero whatever the camera did while present.
Butts (2024) and Clarke (2017) are developing spillover-robust versions. Neither yet solves the problem that Toronto has no camera sites far enough away to serve as uncontaminated controls.
Every remaining finding, one line each
| Finding | Result | p |
|---|---|---|
| Speeds at the same sites (SickKids/TMU 2025) | Share speeding −45%; 20+ km/h over −88%; 85th percentile −10.7 km/h | published |
| Reintroduction memory, 96 returning cameras | Tickets/day 14.6 → 10.5 (−36%); 72% of sites lower | <0.001 |
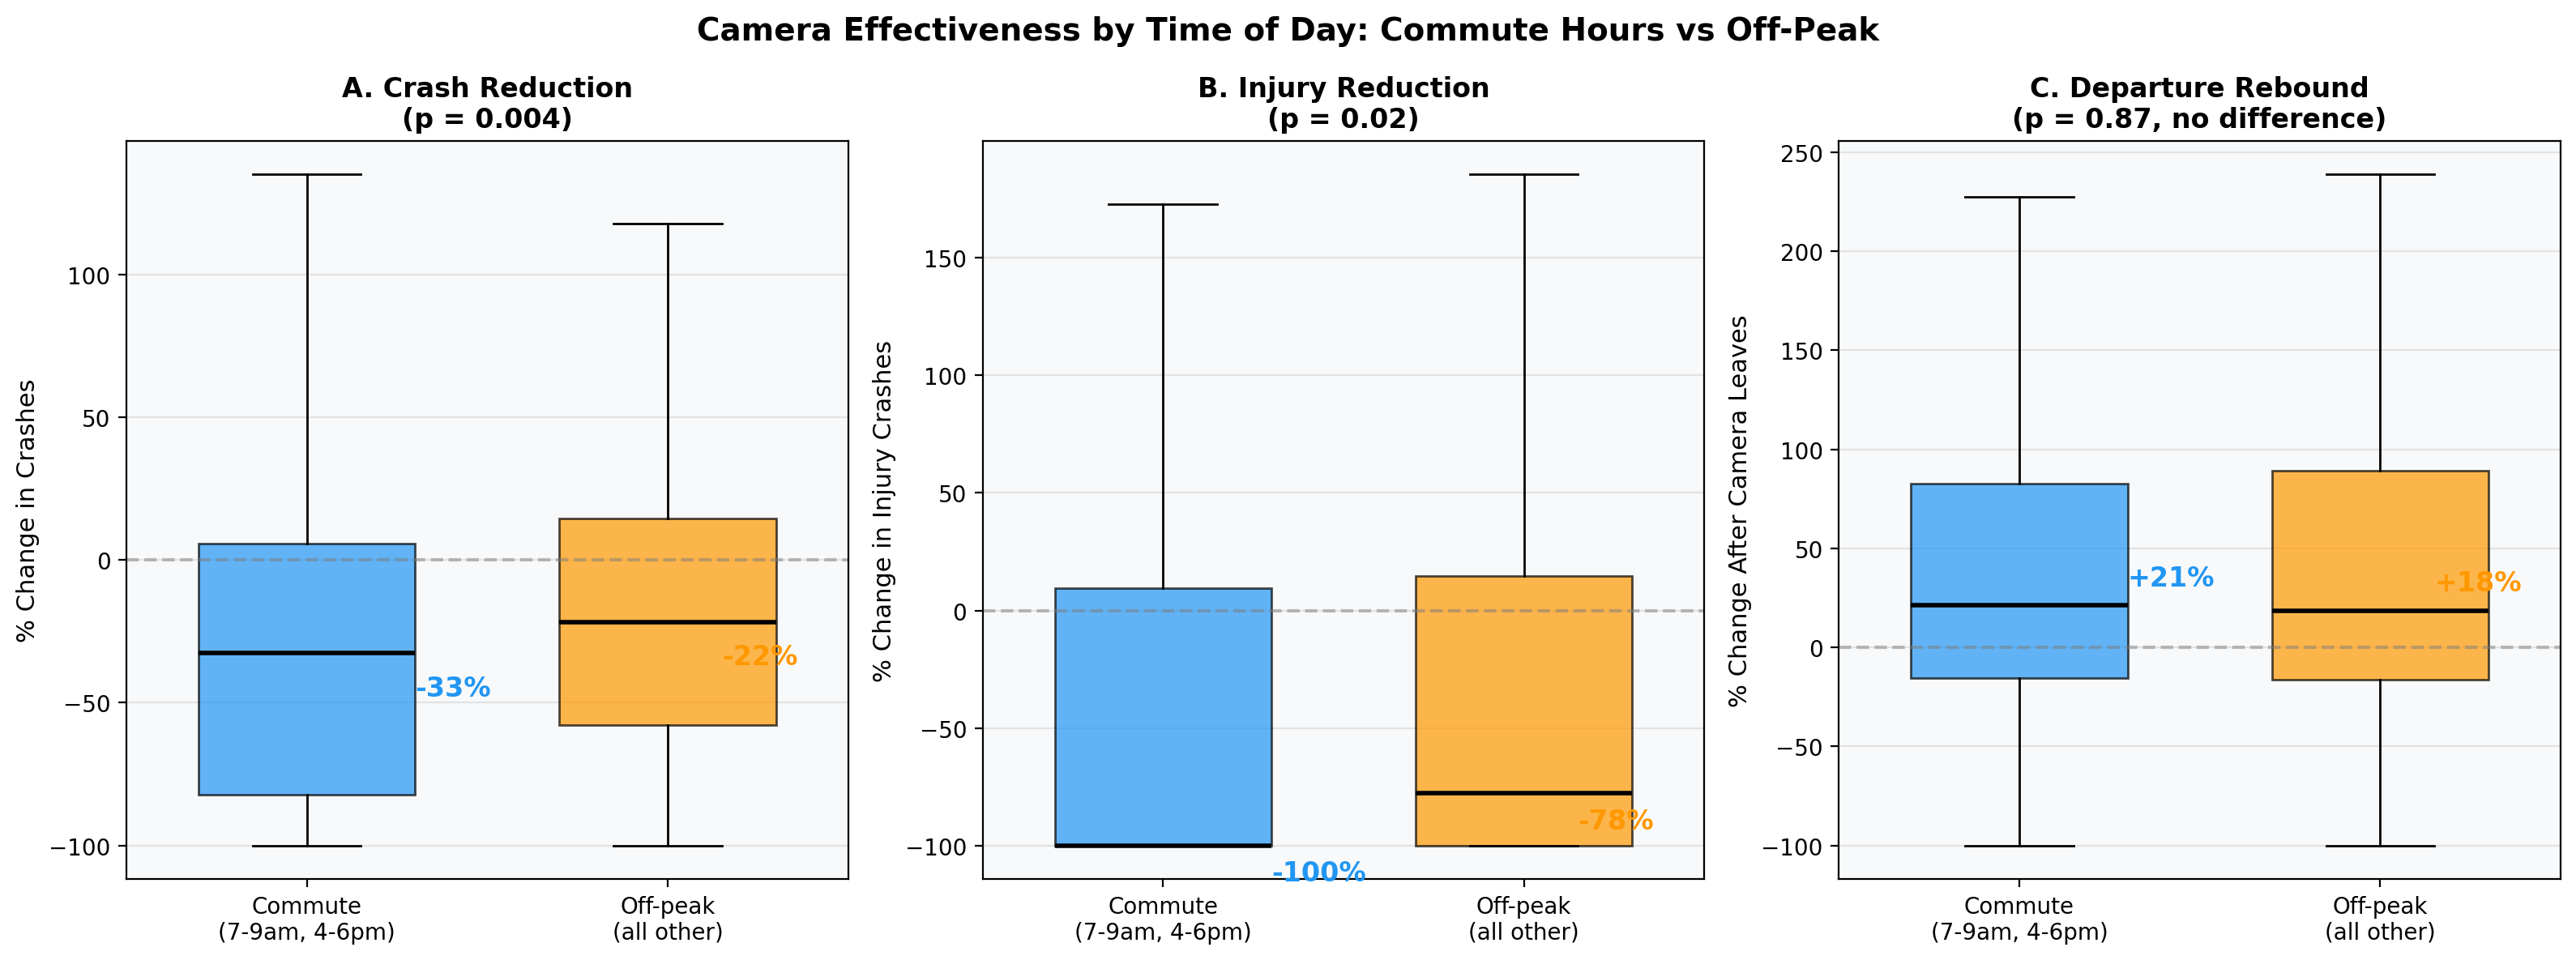
| Commute vs off-peak | Crash effect −33% commute vs −22% off-peak; rebound equal at all hours | 0.004 / 0.87 |
| Time on station | No growth or fade once calendar is controlled | 0.59 |
| Dose-response, tickets vs crash change | Flat (ρ = 0.08); all four quartiles at −4 to −6% | 0.09 |
| Traffic-calming interaction | −10.6% with calming within 250 m vs −9.9% without | 0.45 |
| Predicting which camera works | Baseline crash rate the only stable predictor; cross-validated R² ≈ 0 | 0.003 |
| Network concentration | 40 sites carried 50% of benefit; ~468 of 520 needed for 90% prospectively | 0.22 |
| Ward and voting patterns | No significant variation by ward or by provincial vote | 0.21 / 0.40 |
| Socioeconomic variation | No detectable difference by income, poverty or visible-minority share | 0.486 |