What five years of Toronto's rotating speed cameras, and the first seven months after every one was switched off, show in the collision record.
The programme
Toronto ran the only large North American speed camera programme that rotated its cameras. From July 2020 to November 2025, roughly 50 units rotated across 520 sites in all 25 wards over 627 enforcement periods, typically three to six months at a time, with 96 sites cycled more than once. Each site therefore has its own before, during and after, and can be compared with itself rather than with a different street across town. That matters because cameras were placed deliberately at the city's worst locations, so any comparison against other places measures where cameras went as much as what they did.
We matched 790,725 Toronto Police collision records from 2014 through 2025 to all 520 sites. As far as we know, no previous Canadian evaluation has matched individual collision records to individual camera locations; earlier studies used aggregate crash counts or speed compliance data. Ontario's Bill 56 received Royal Assent on 3 November 2025 and every camera came down on 13 November.
Crashes
Crash rates ran lower at a site while its camera operated, and how much lower depends on the design. Within-site designs cluster between −5 and −10 percent; designs that also net out the calendar sit lower. We read −4 to −7 percent as defensible and decline to publish a single number.
| Design | Estimate | p |
|---|---|---|
| Within-site, raw (each site vs itself) | −10.2% | 2.2 × 10⁻⁶ |
| Within-site, 2017-truncated baseline (RTM guard) | −6.9% | n/a |
| Within-site, cohort-weighted decomposition | −5.5% | n/a |
| Calendar-matched control cells | −3.9% | 0.006 |
| Callaway–Sant'Anna (assumption questioned) | +1% to +3% | n.s. |
The average conceals real unevenness. 304 of 520 sites recorded fewer crashes during enforcement and 216 recorded more, so about four in ten showed no improvement. Three of our eleven formal tests came out significant in the wrong direction, which we read as the signature of placement at the worst locations rather than of cameras causing harm.
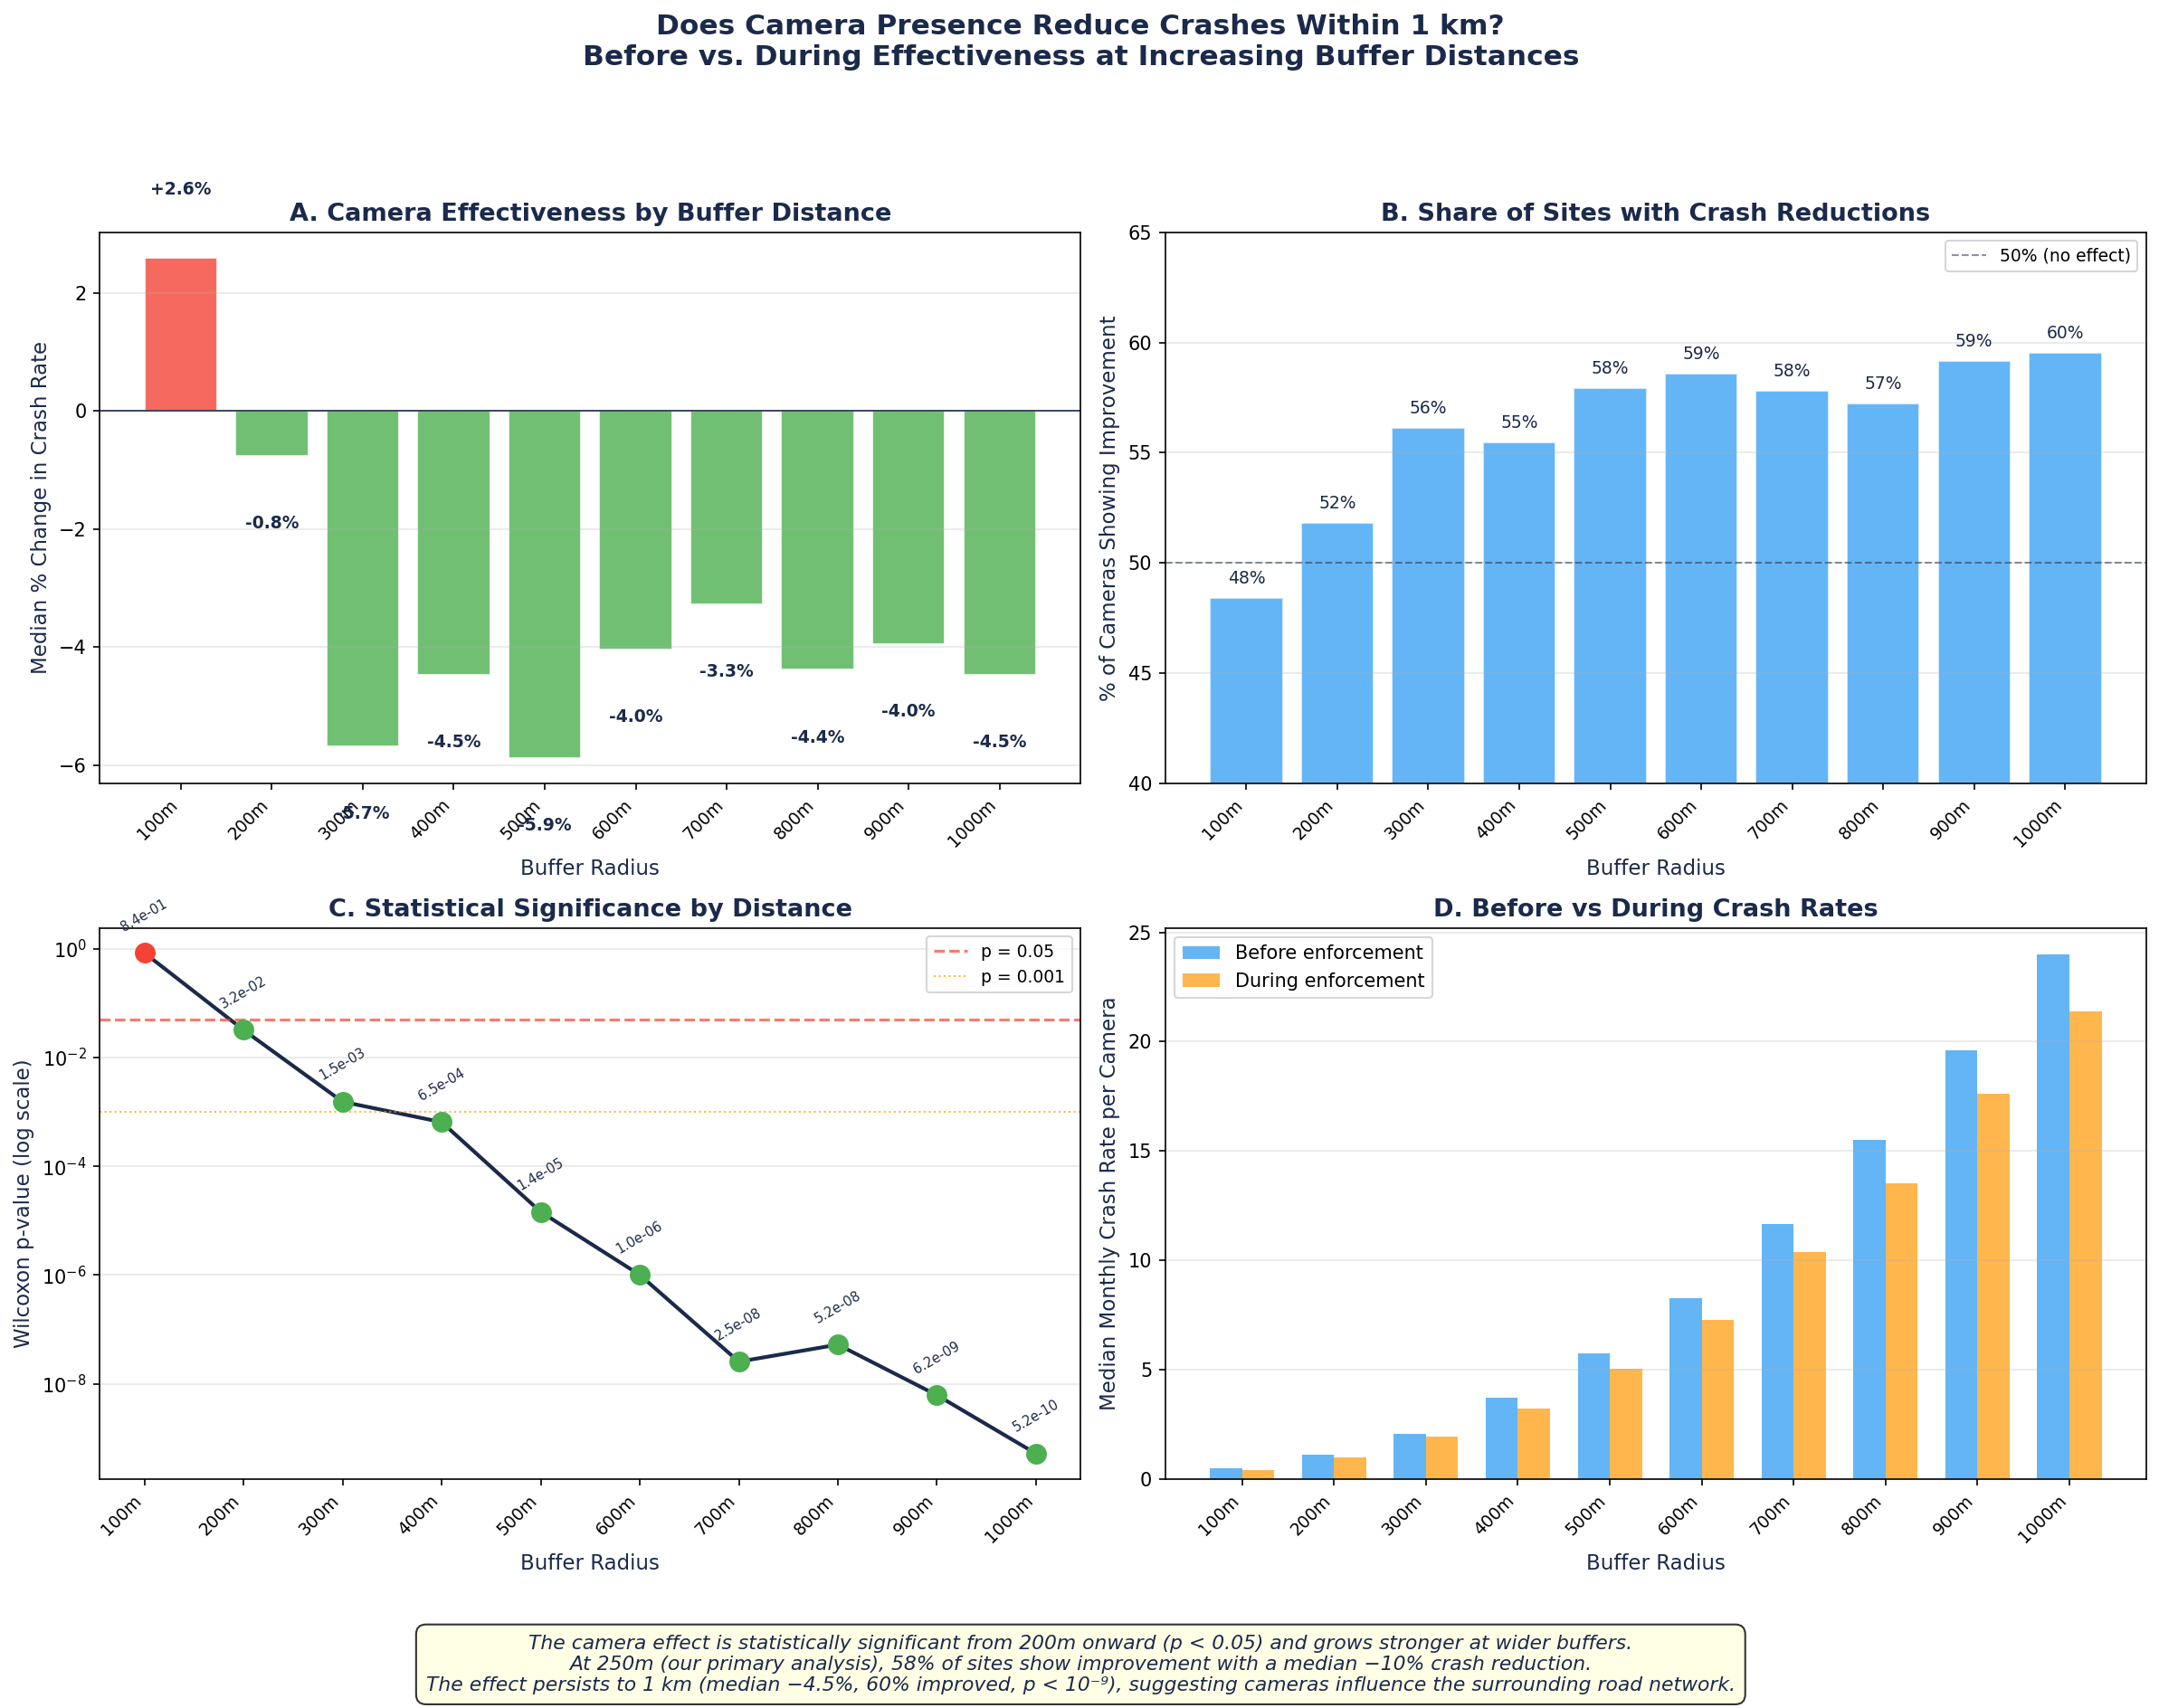
The effect holds at every buffer distance
| Buffer | Crashes near camera | Median change | Sites improved | p |
|---|---|---|---|---|
| 100 m | 43,795 | −22.9% | 63.6% | 2.6 × 10⁻⁶ |
| 150 m | 64,113 | −15.6% | 61.3% | 8.3 × 10⁻⁶ |
| 200 m | 89,413 | −9.3% | 58.7% | 8.7 × 10⁻⁶ |
| 250 m (primary) | 126,644 | −10.2% | 58.5% | 1.0 × 10⁻⁵ |
| 400 m | 250,354 | −4.8% | 56.0% | 3.0 × 10⁻⁴ |
| 500 m | 337,219 | −6.1% | 58.1% | 1.2 × 10⁻⁵ |
Injuries
The clearer association is with fewer people hurt. In a staggered comparison with year controls, the odds that a collision near a camera involved injury declined about 8 percent more than in the rest of the city.
| Measure | Value | p |
|---|---|---|
| Injury odds near cameras, staggered DiD with year controls | OR 0.920 (≈ −8%) | 2.3 × 10⁻⁵ |
| Same, simpler specification | OR 0.951 | 0.005 |
| Sites with injury-rate rise after camera departure | 46% (no rebound) | 0.94 |
| Median monthly injury rate, during → after | 0.164 → 0.124 | n/a |
| Injury share of crashes, before → during → after | 15.1% → 14.4% → 14.0% | n/a |
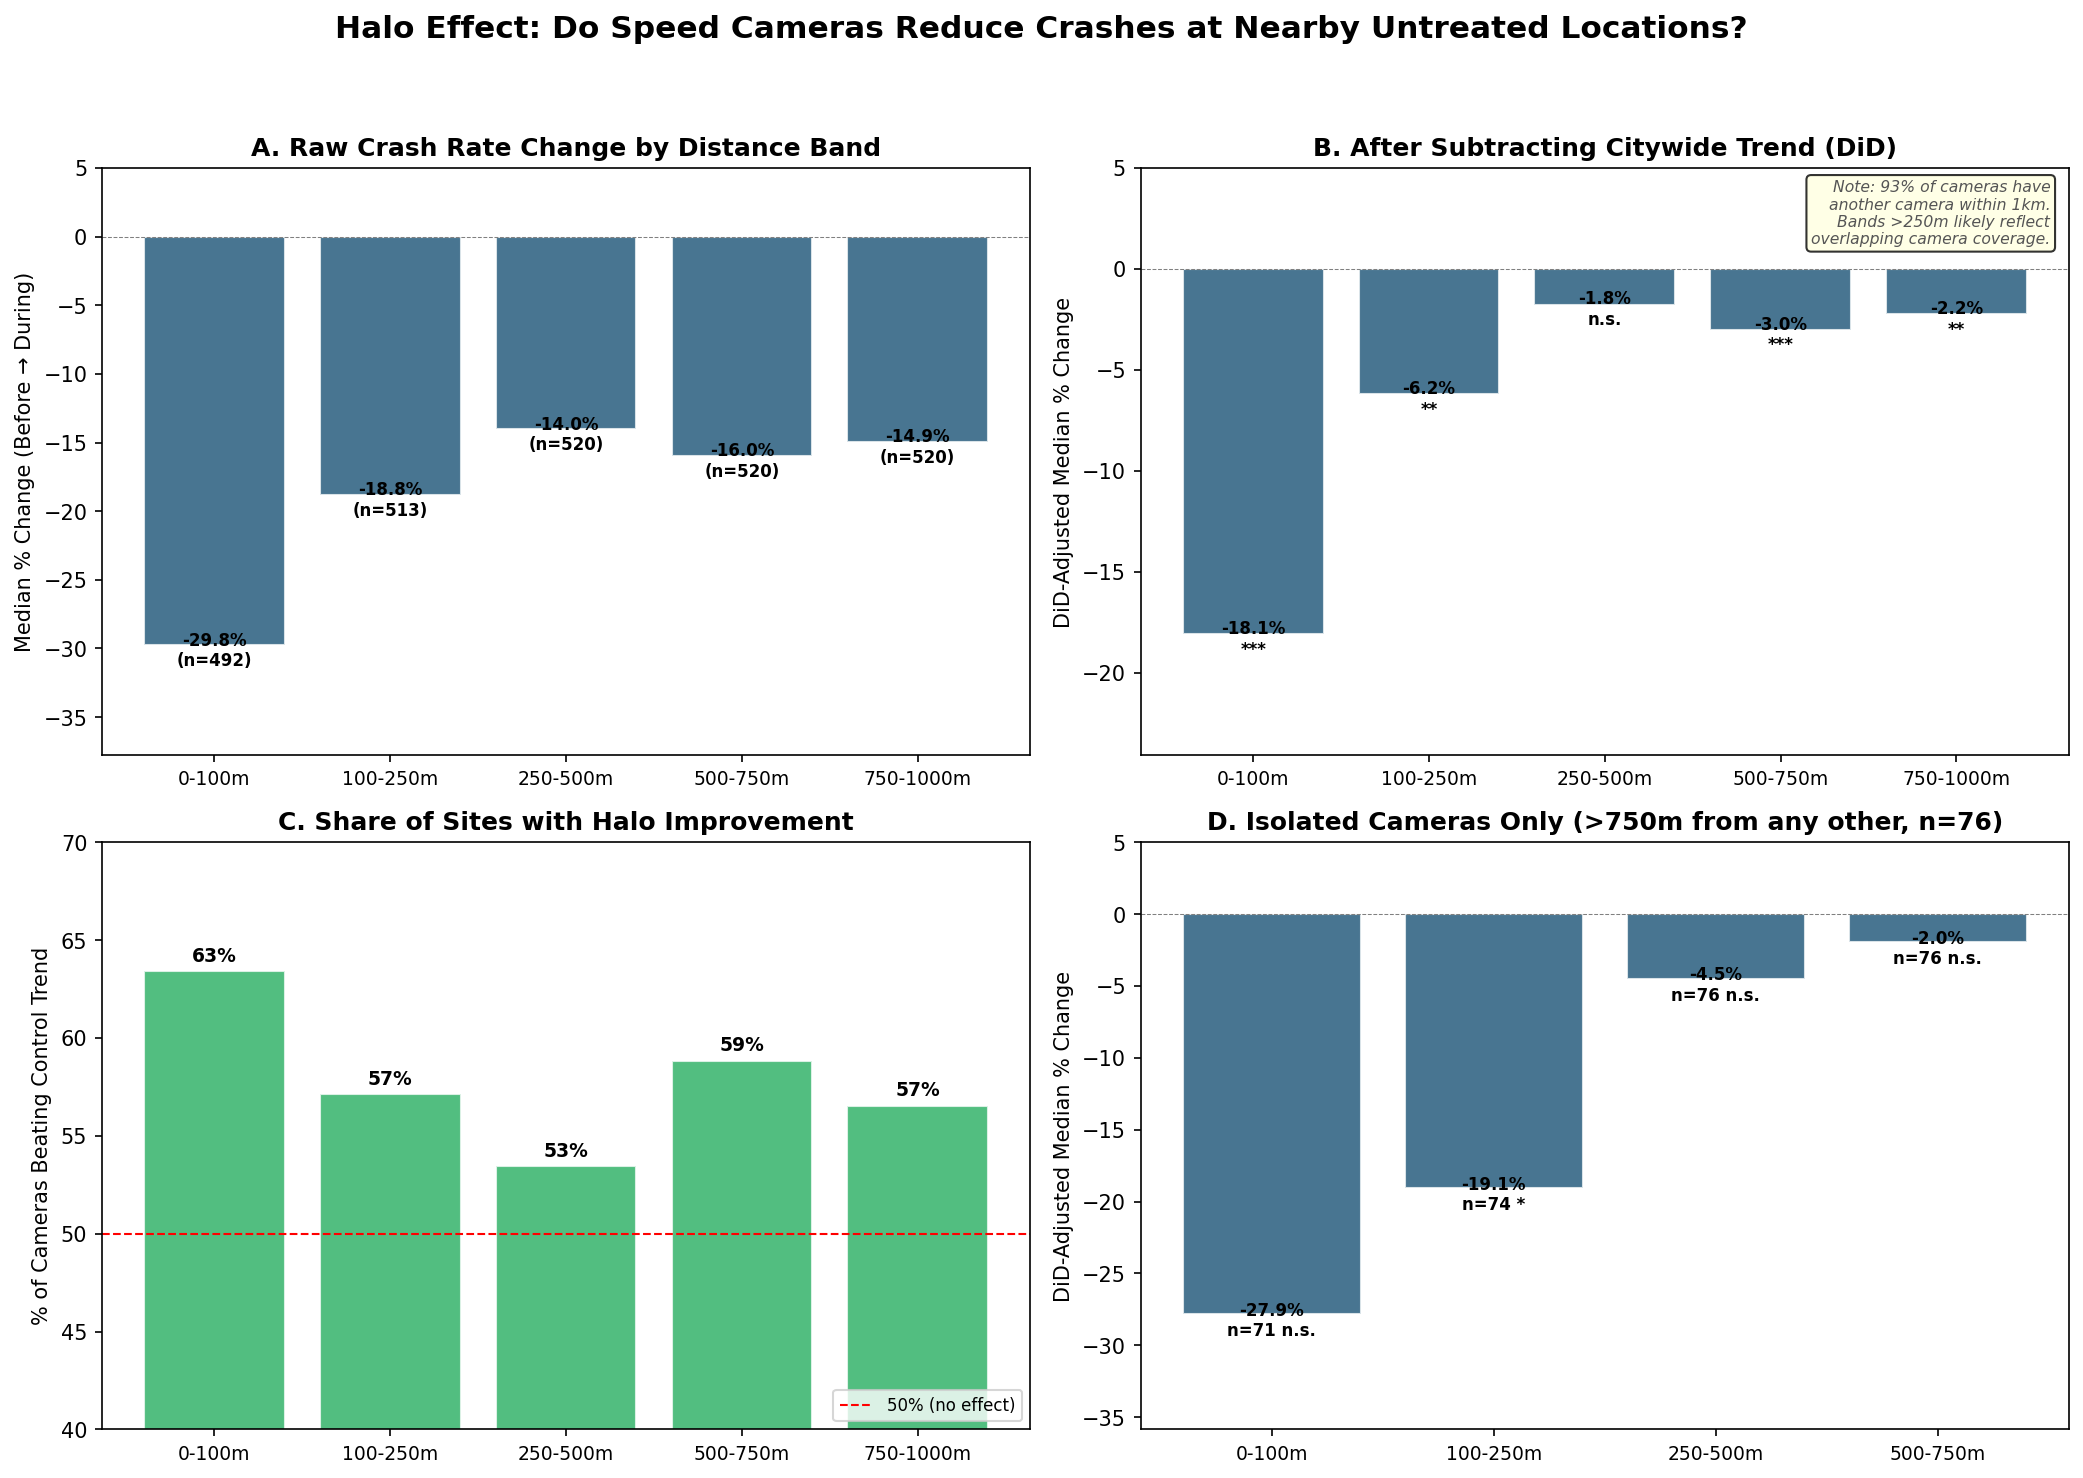
Two things distinguish the injury result. It did not reverse when cameras left, and it reaches farther than the crash benefit: at the 76 isolated cameras a trend-adjusted injury reduction near 24 percent appears out to 250 to 500 metres, where the crash reduction has already faded. An independent SickKids and Toronto Metropolitan University team measuring speeds rather than crashes found the share of vehicles speeding at camera sites down 45 percent, and the share travelling 20 km/h or more over the limit down 88 percent.
Deaths and serious injuries
We estimate rather than measure this. The programme's 5.4 years work out at roughly 4 to 15 killed-or-seriously-injured outcomes prevented, and its removal at about 1 to 3 a year. The KSI file records 35 people killed or seriously injured near camera sites while cameras operated. That file ends in December 2023 and covers 48 percent of enforcement days, so the count is incomplete and no direct test is available to us. The figure scales the measured injury effect by an observed rate of 0.06 KSI persons per injury collision.
| Estimate | Prevented KSI persons, 5.4 years | Per year |
|---|---|---|
| Lower bound (RTM-adjusted −4% effect) | ~4 | ~1 |
| Central (within-site Poisson −9.6%) | ~9 | ~2 |
| Upper (central + halo zone) | ~15 | ~3 |
Our direct evidence on severe injury comes from London, where the KSI ratio near 304 cameras narrowed from 1.09 to 1.02 after installation.
What happened when cameras left
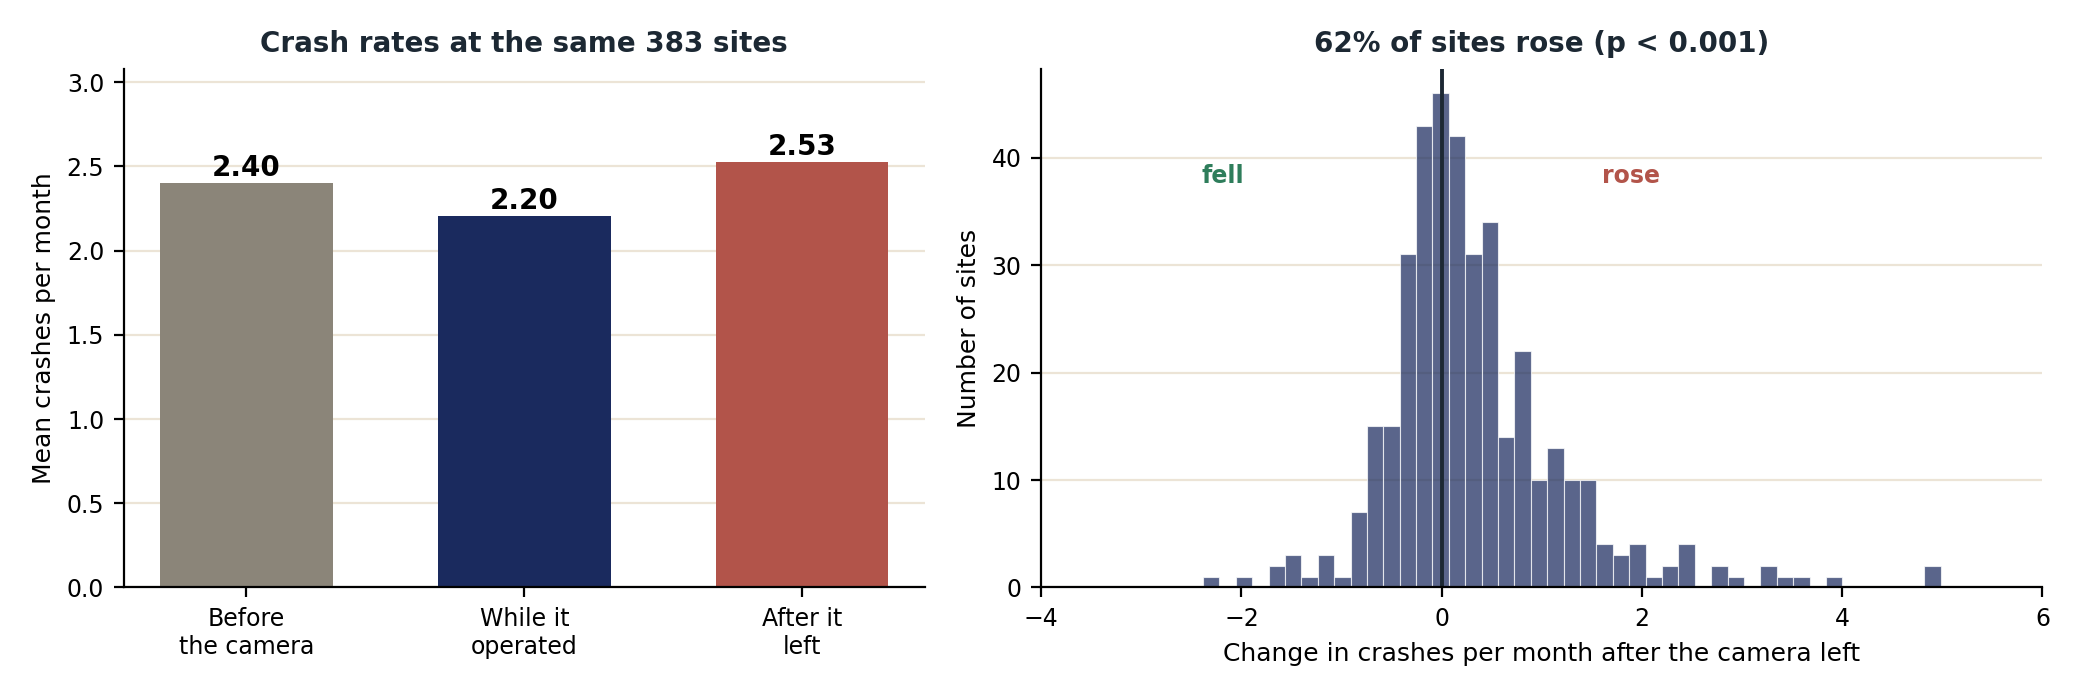
Among the 383 sites with a non-zero rate in both periods and at least three months of data afterwards, crash rates rose at 62 percent once the camera was removed. This is the evidence the rotational design exists to produce, since a downward trend or regression to the mean gives crashes no reason to climb when the camera goes.
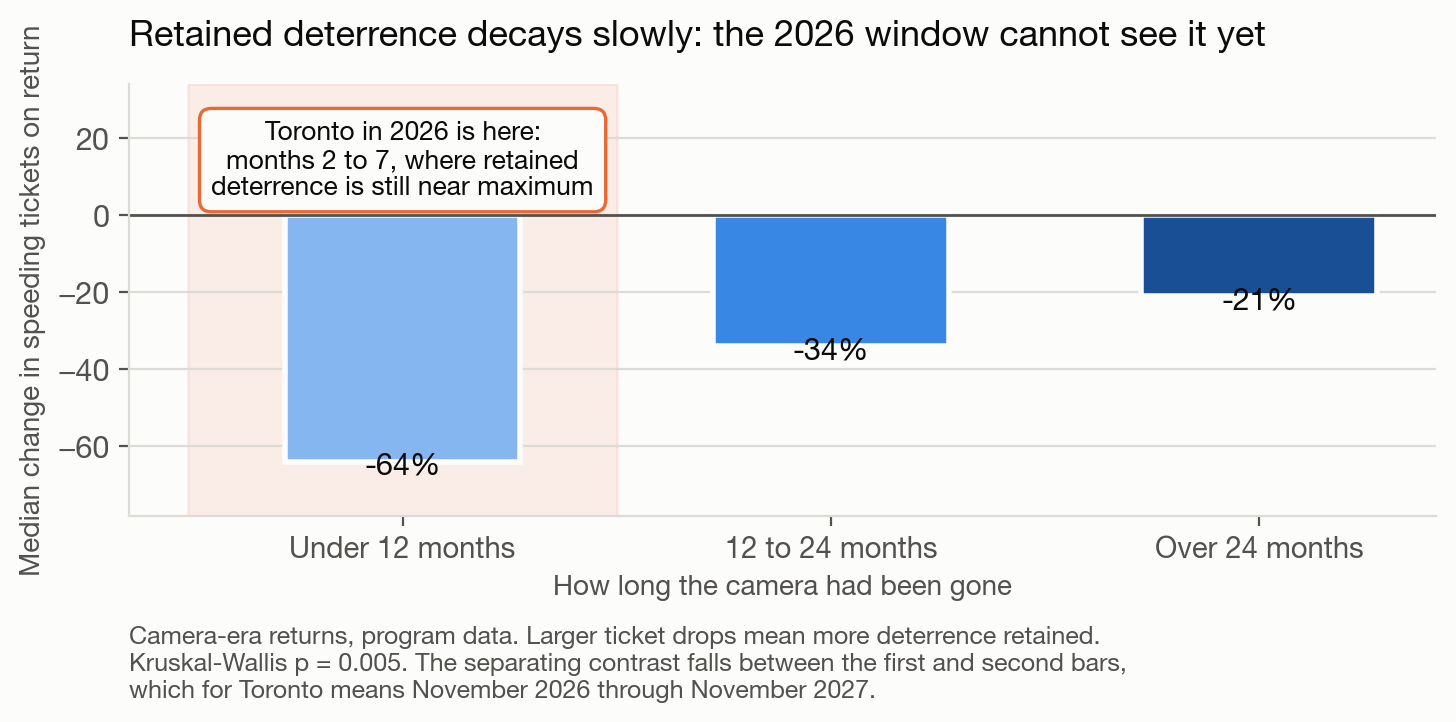
Drivers appear to remember a camera, and that memory decays as the gap lengthens. At the 96 sites where a camera later returned, it issued about a third fewer tickets than on its first deployment, 14.6 a day falling to 10.5, with 72 percent of sites lower. The reduction is deepest, near two-thirds, when the camera returned within a year, and thins to about a fifth after gaps beyond two years.
How we know this is not simply the pandemic
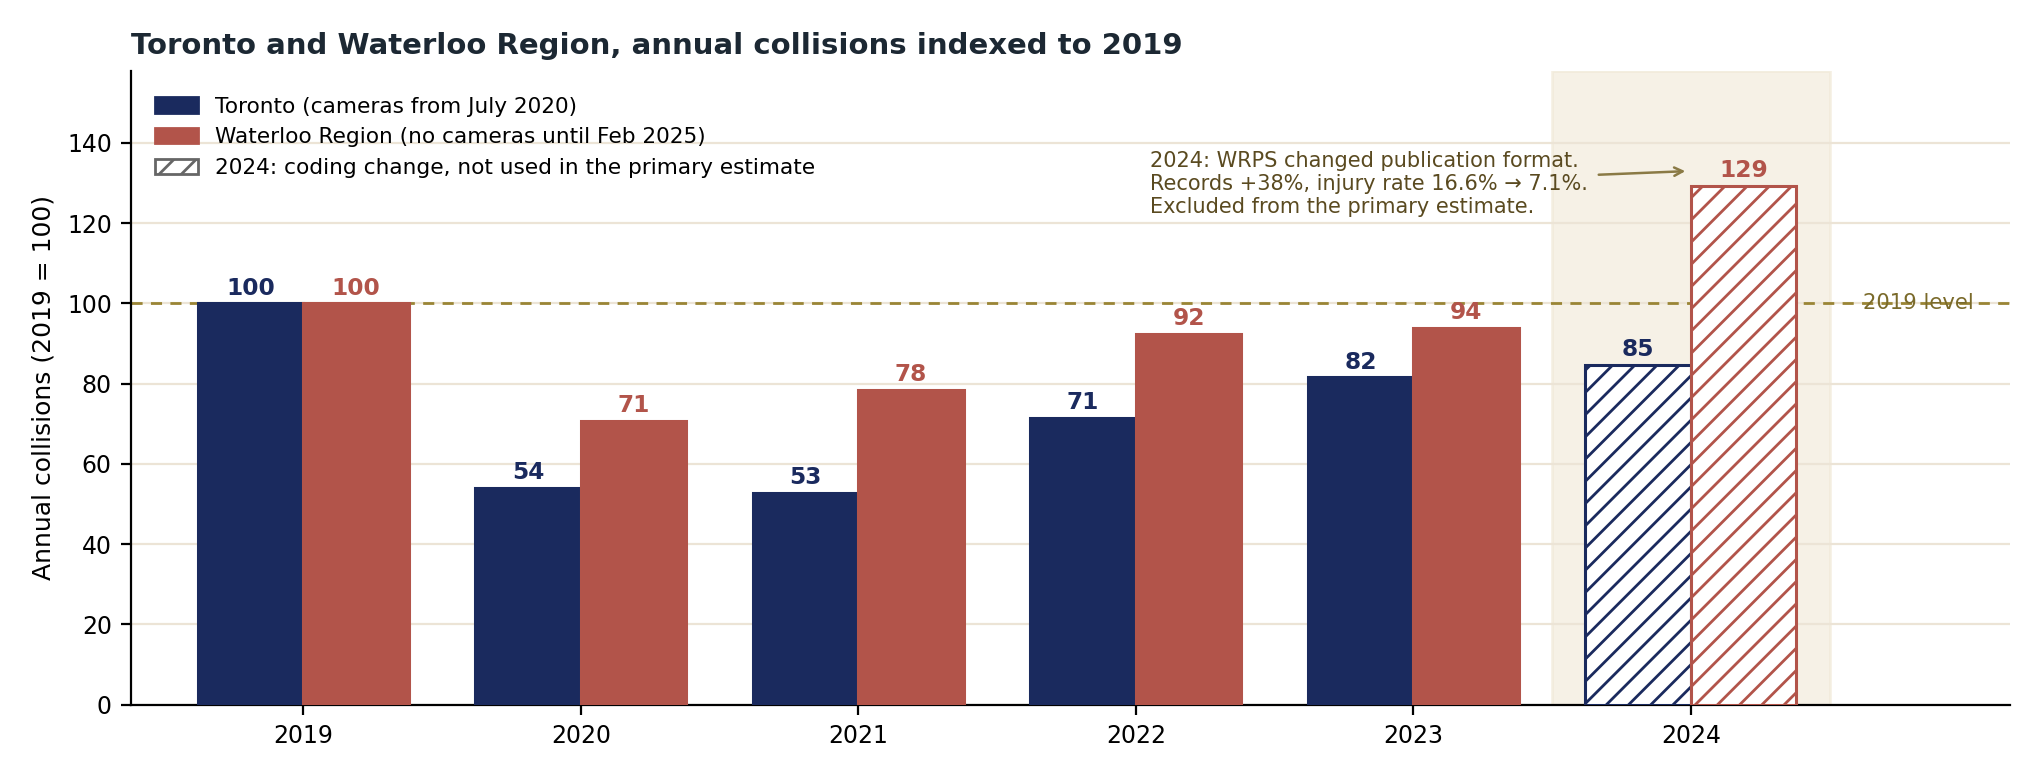
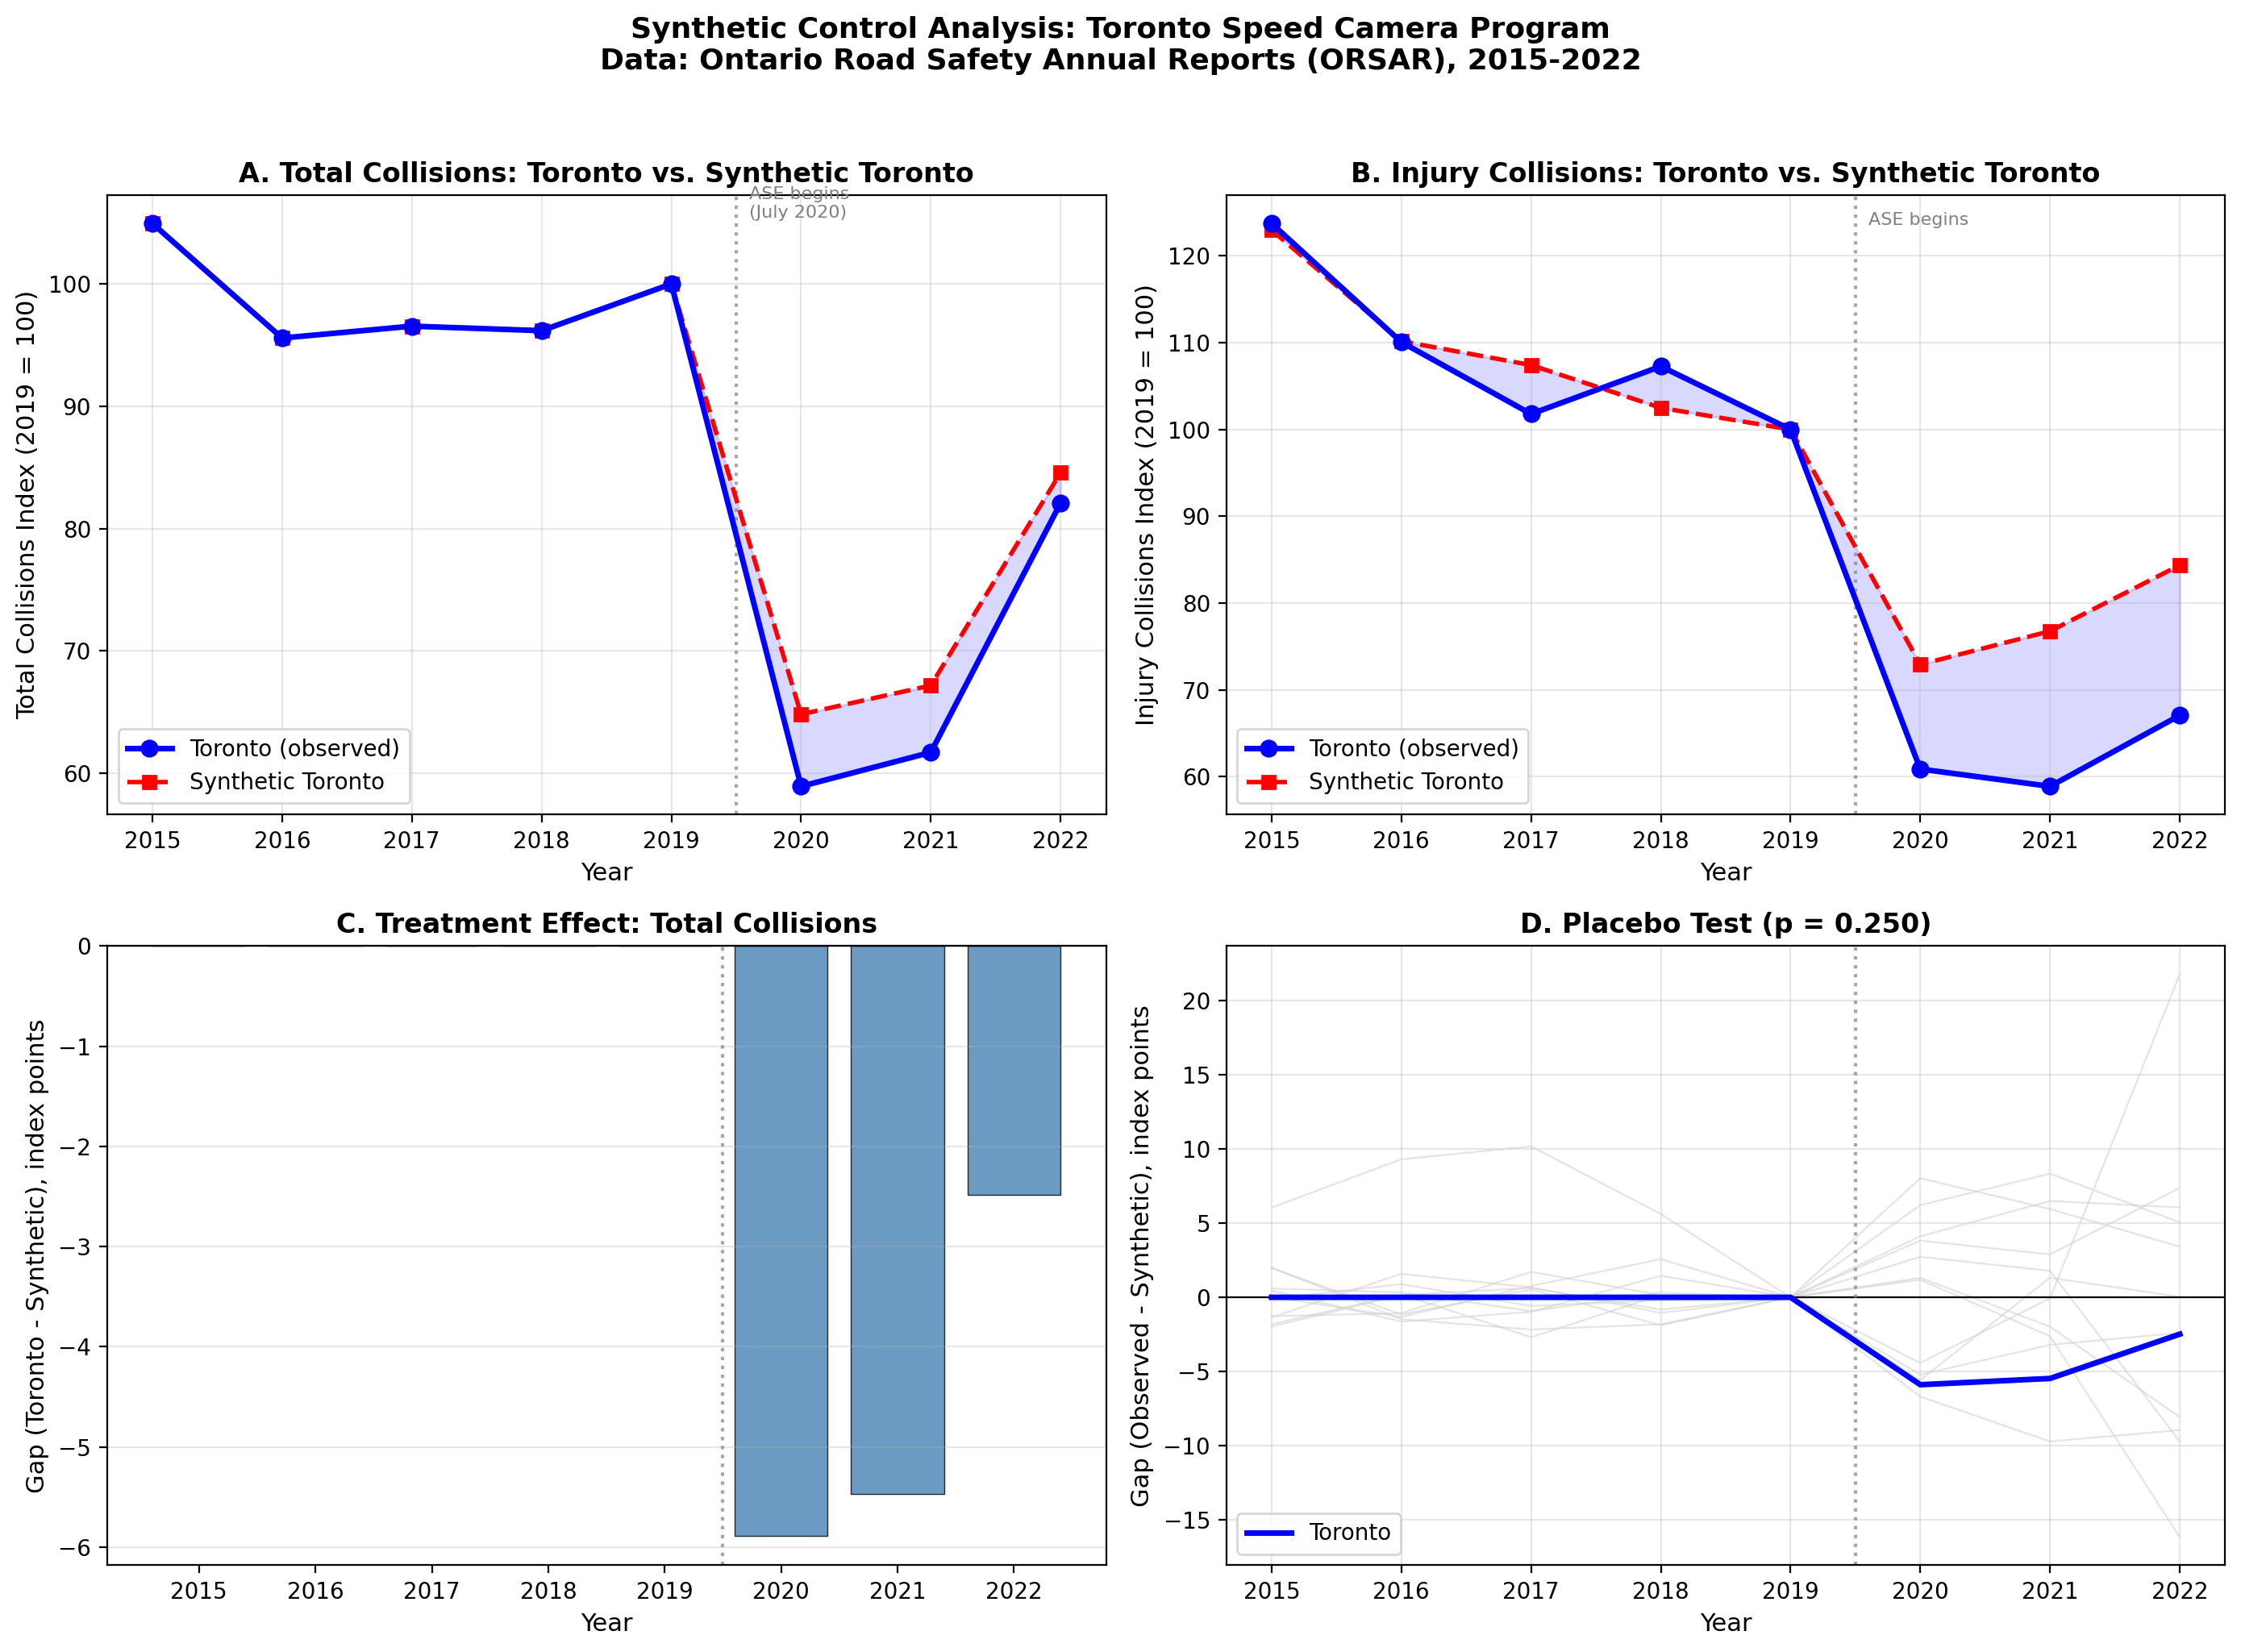
The programme launched in July 2020, mid-collapse in traffic volumes, so any before-and-after comparison risks reading the recovery as a camera effect. Waterloo Region shares Ontario driving law, the pandemic timeline and similar urban form, and deployed no automated enforcement until February 2025.
| Specification | DiD estimate (index pts) | 95% CI | p |
|---|---|---|---|
| All collisions, 2019–2023 (primary) | −19.2 | [−38.5, 0.1] | 0.051 |
| All collisions, 2019–2024 | −25.2 | [−46.9, −3.5] | 0.023 |
| Injury collisions, 2019–2023 (upper bound) | −55.1 | [−74.9, −35.2] | <0.0001 |
| All collisions excl. hit-and-run, 2019–2023 | −22.3 | [−41.7, −2.9] | 0.024 |
Parallel pre-trends hold for total collisions (p = 0.24) and fail for injury collisions (p = 0.04), so the injury figures are labelled an upper bound and borrow none of this design's authority. With two cities no standard error is fully valid, a serial-correlation correction widens the interval past zero, and one control city cannot rule out a Toronto-specific shock arriving with the cameras.
Police enforcement
Cameras and officers operated independently, and we found no evidence of substitution in either direction. Both tests run at neighbourhood level, which limits their power.
| Measure | Value | p |
|---|---|---|
| Speeding tickets, cameras vs police radar | 2,150,715 vs 436,307 (≈ 4.9 : 1) | n/a |
| Police ticketing change after 2020, camera vs non-camera areas | +124% vs +122% | n/a |
| Camera effectiveness by police-activity tercile | no gradient | 0.41 |
| Same, controlling for baseline crash rate | no gradient | 0.34 |
| Crash rise after removal, by police response | ≈ +28% either way | 0.62 |
| Police backfill of camera gaps, per active camera-month | −0.4% | 0.65 |
| Tickets per month, median camera vs officer | 280 vs 76 | n/a |
| Replacing 50 cameras' output | ≈ 185 officers; $25.8M vs $2.5M | n/a |
Covering all 520 sites around the clock would take an estimated 5,756 officers, more than the entire Service. Ticket volume is not the right metric, though, and the substitution tests suggest even volume-matched officer enforcement would not have prevented the post-removal rise.
The camera-free year
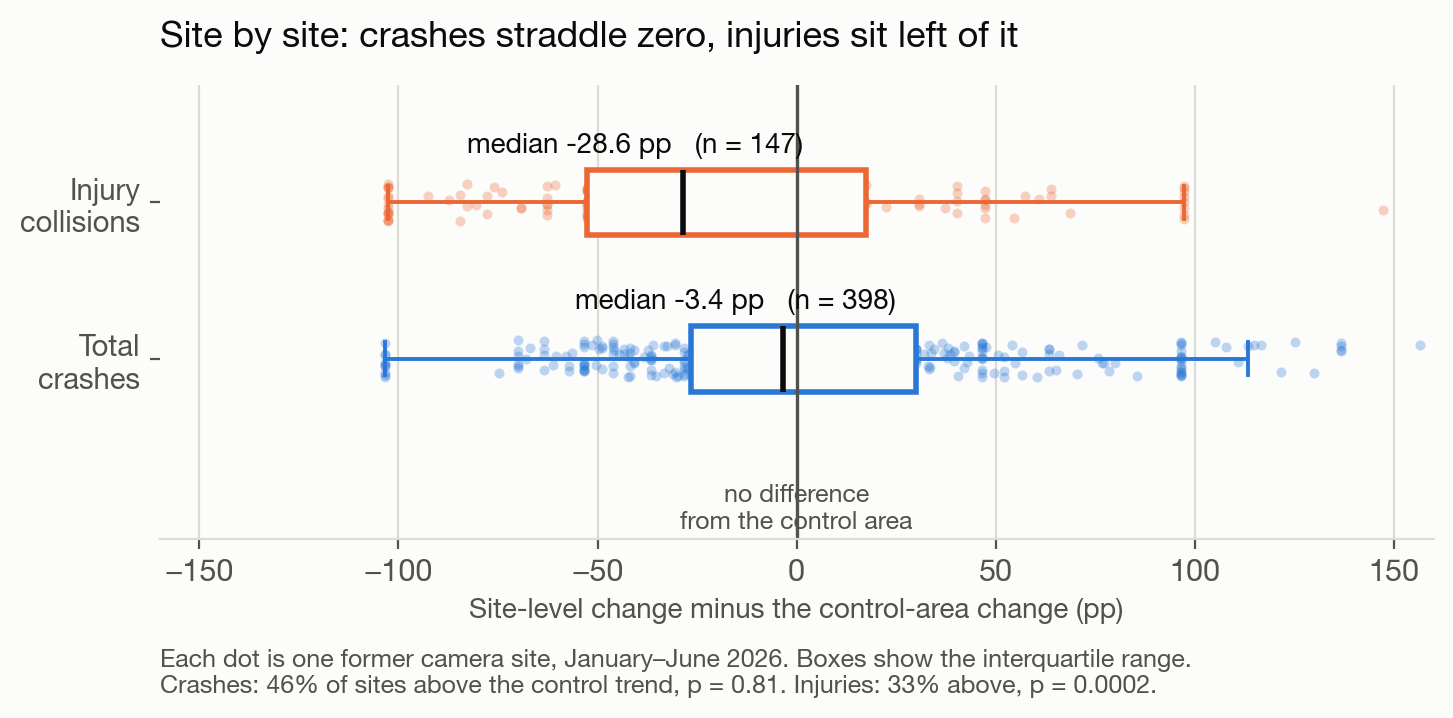
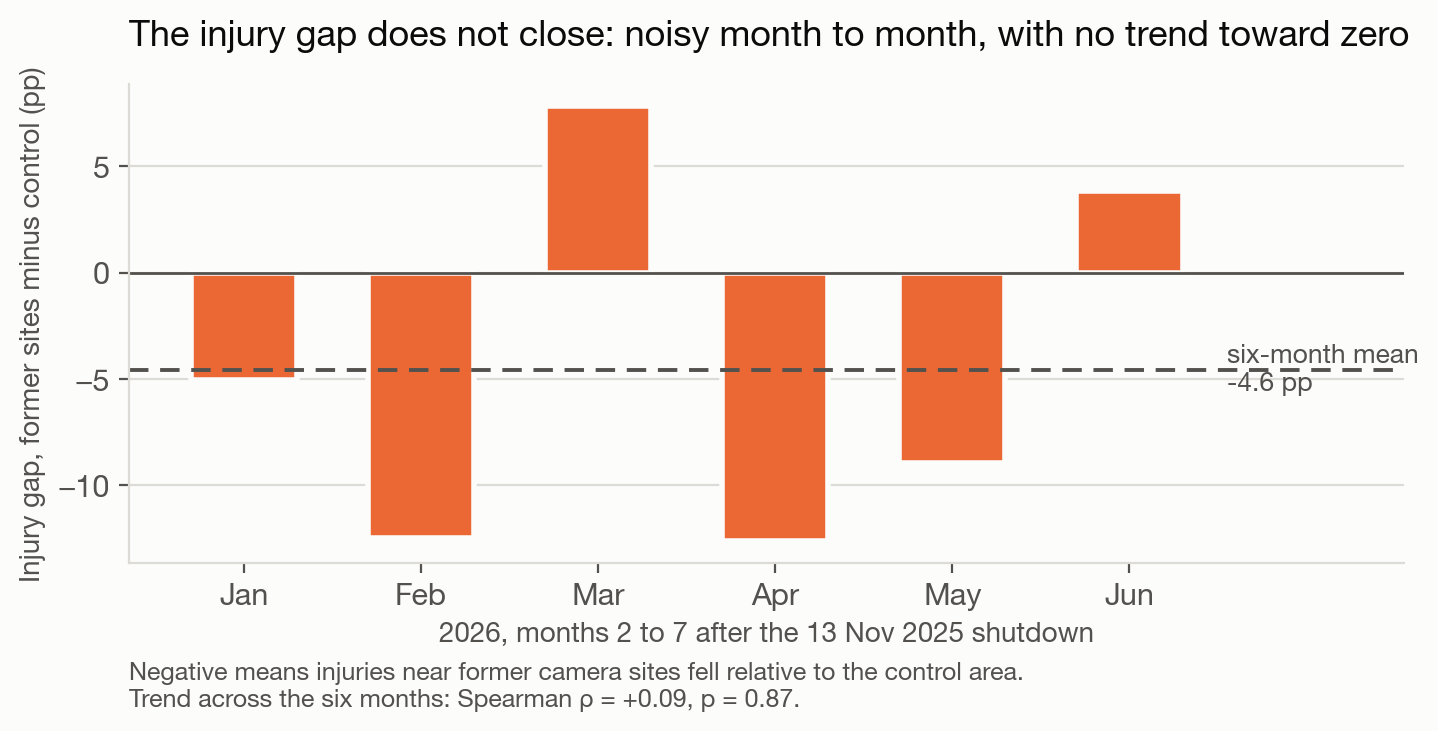
We committed our predictions in writing on 18 July 2026, before any 2026 collision record was pulled, and ran them with frozen, checksummed code. Through June 2026 crashes at former sites rose no faster than the rest of the city. Injuries ran the other way.
| Window (2026) | Former-site crash excess | Share above control | p | Injury excess | p |
|---|---|---|---|---|---|
| Jan–Apr (sealed primary) | −6.9 pp | 47.6% | 0.998 | −33.6 pp | <0.001 |
| Jan–May (sensitivity) | −3.8 pp | 45.5% | 0.971 | −33.6 pp | <0.001 |
| Jan–Jun (sensitivity) | −3.4 pp | 45.7% | 0.811 | −28.6 pp | <0.001 |
Two accounts of the suppression, both still open
Drivers trained by five years of enforcement may have kept the habit, or the standing school-zone features that remain at nearly every former site may carry it: signage, markings, zone speed limits. The channels we can measure do not explain it. The suppression is at least as deep at sites that never had a co-deployed radar sign, physical co-treatment exposure does not track it (p = 0.85), and camera tenure shows no dose relationship (ρ = −0.08, p = 0.36).
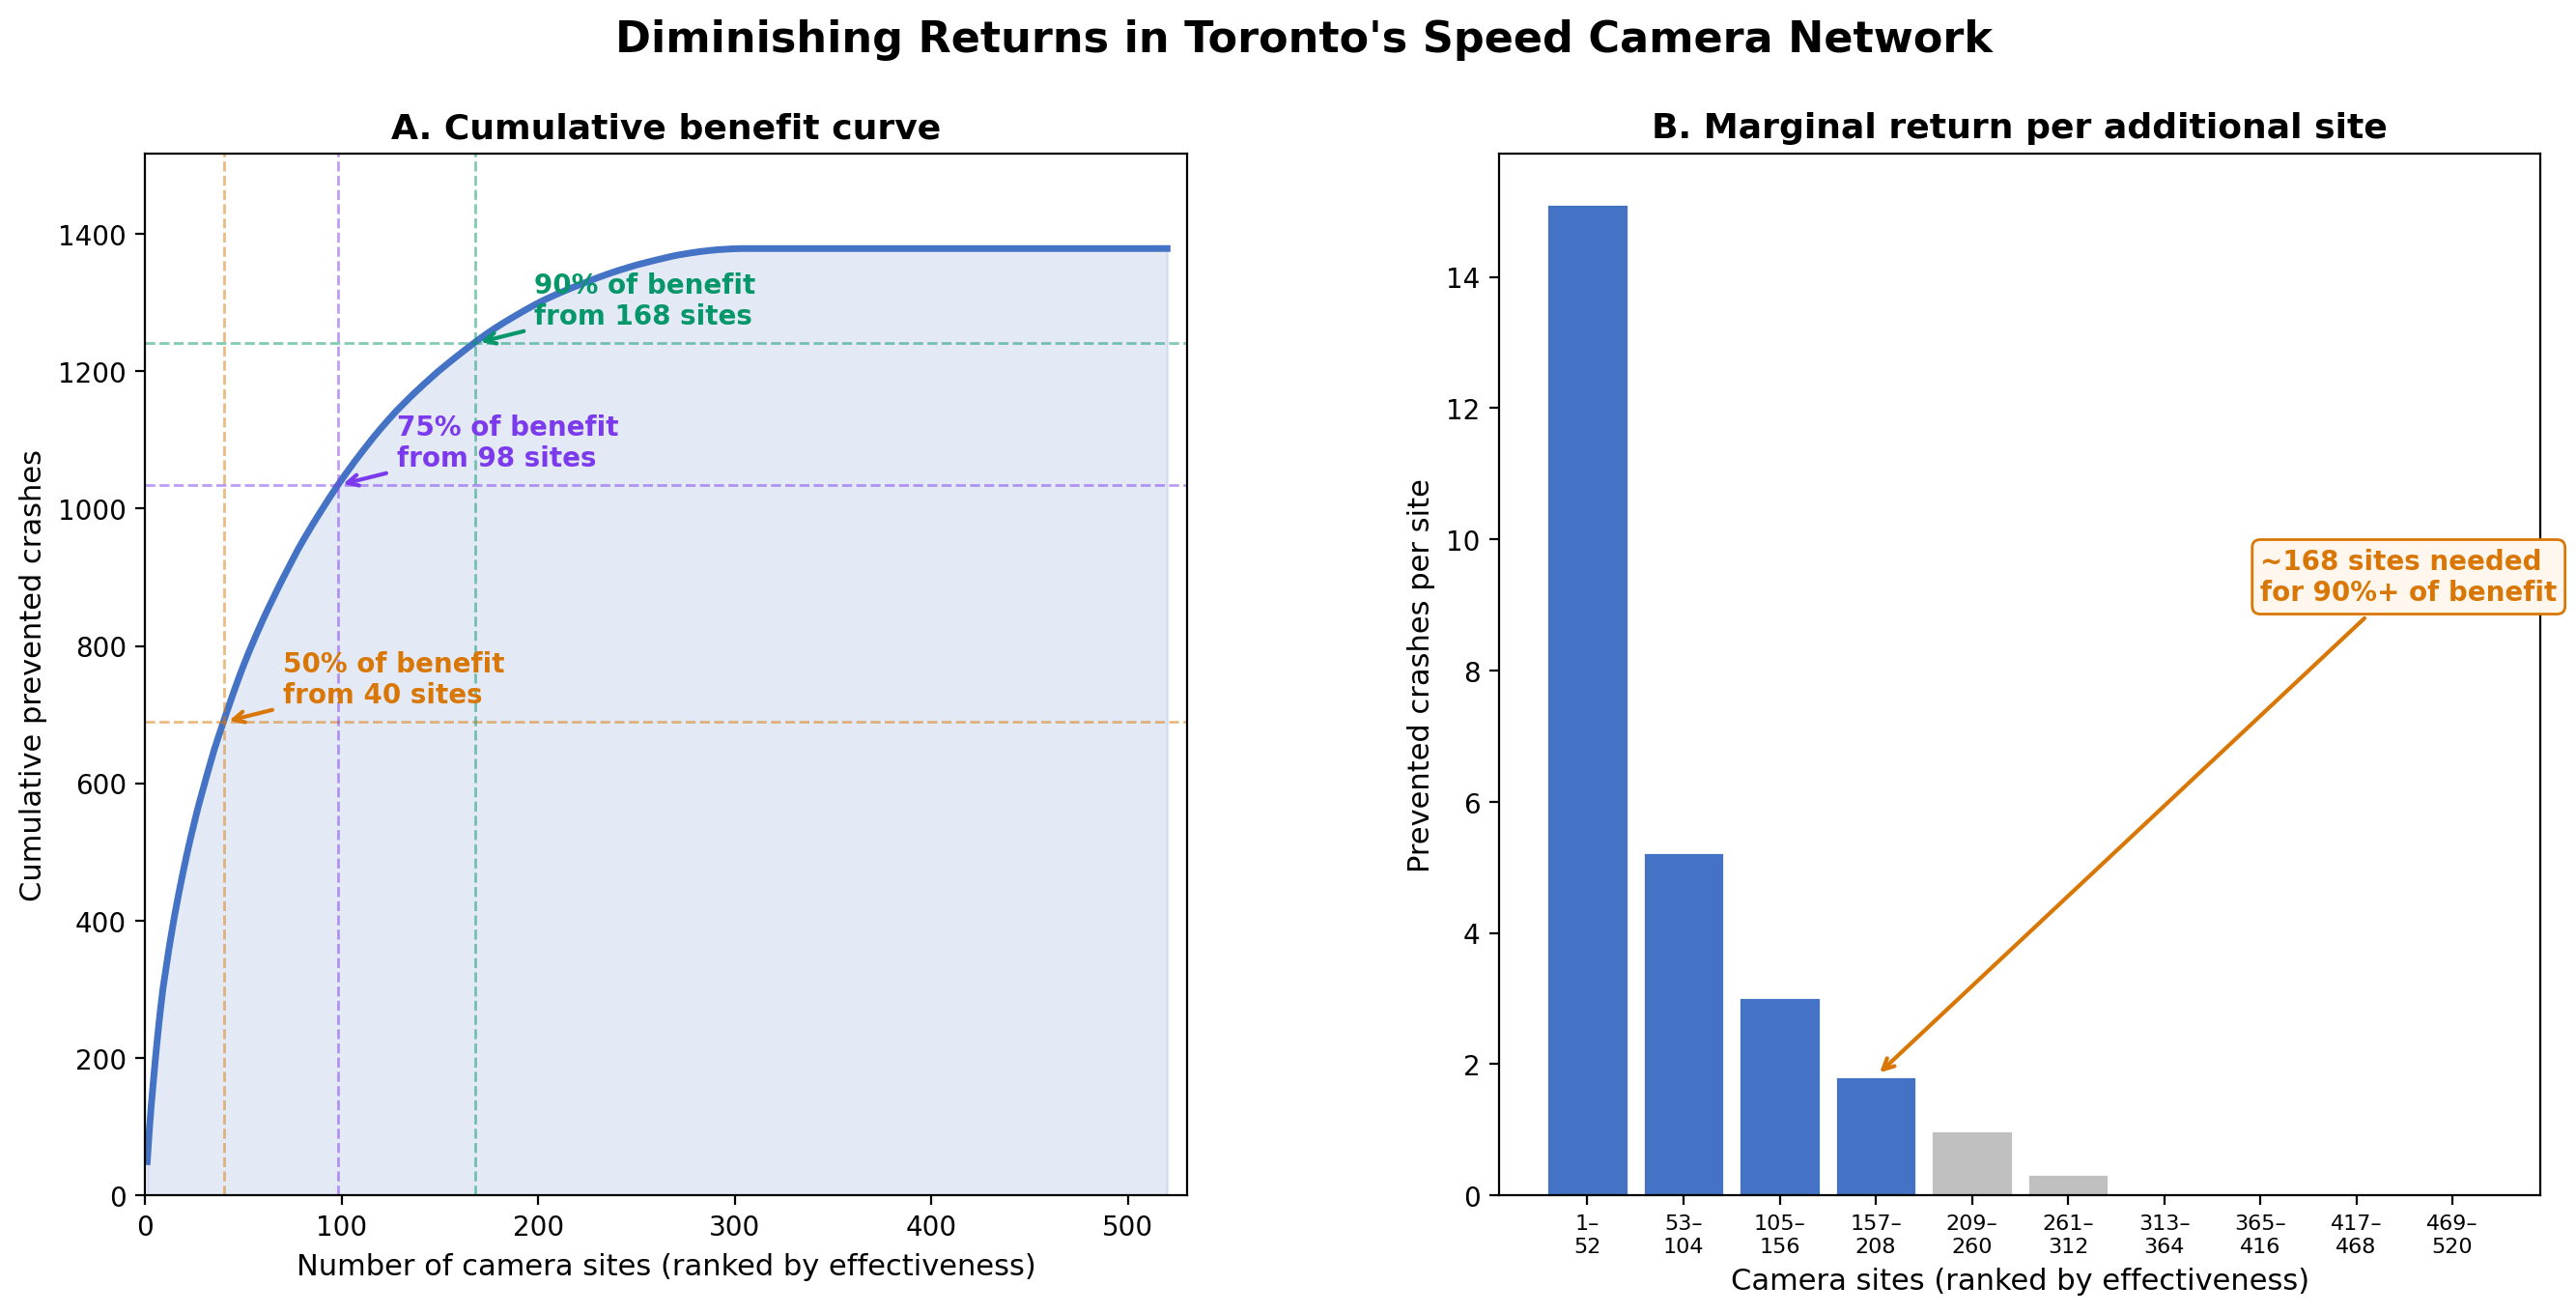
Equity, and how many cameras a network needs
Among the 228 sites we could match to Census neighbourhoods, 43 percent sat in Neighbourhood Improvement Areas or Emerging Neighbourhoods against 27 percent of neighbourhoods citywide. That placement is a fact. Whether cameras worked differently there is an estimate, and within our power the answer is no: we detected no difference in benefit by income, poverty rate, visible-minority share or the City's composite wellbeing index, with p-values from 0.15 to 0.63. We report it as a null with limited power.
Four sites, four patterns
The city-wide numbers say 58 percent of cameras recorded fewer crashes and injury rates generally fell. Individual sites do not always agree with that average. We paired eight cameras into four near-statistical twins, matched on baseline crash rate, injury profile and enforcement history, and each pair sits in a different quadrant of the crash-count × injury-severity space.
| Pattern | What happened | Sites |
|---|---|---|
| A. Both improved | Crash count down, injury rate down | A157 (Priscilla Ave.) and A467 (Jarvis St.) |
| B. Crashes only | Crash count down, injury rate flat or up | A122 (Clinton St.) and A315 (Tapscott Rd.) |
| C. Severity only | Crash count flat or up, injury rate down | A221 (St. Clair Ave. W.) and A268 (Bloor St. E.) |
| D. Neither | Neither measure changed much | A018 (Gladstone Ave.) and A093 (Birchmount Rd.) |
Pair A. A157 sits on a low-volume residential street 9 km from downtown, measured at 34 km/h; A467 is on Jarvis Street through the downtown core, carrying 30 pedestrian and 22 cyclist collisions over 11 years. Both produced a similar result anyway: crash counts fell 18 and 10 percent, and the injury share of crashes roughly halved during enforcement, from about 14 percent to 5 to 7 percent.
Pair B. A122 is a young, cycling-heavy downtown street; A315 sits in a car-dependent Scarborough suburb where 87 percent of residents identify as a visible minority, against 24 percent near A122. Crash counts fell by about a quarter at both, 26 and 22 percent, while the injury share rose, from roughly 13 to 17 percent. Before enforcement only 12 to 13 percent of crashes at these two sites involved injury, below the citywide 15 percent, so removing the easiest, lowest-severity crashes from the count mechanically raises the injury share of what remains. The camera appears to be working on crash volume rather than on severity here, a different result from failing outright.
Pair C. The mirror image: crash counts rose 16 and 17 percent at both sites while the injury share fell by more than half, from about 12 percent to 4 to 5 percent, then partly reverted once enforcement ended. Both sites sit on streetcar or subway corridors, and the pattern is consistent with what the physics of a lower travel speed would predict: little change in how often a crash happens, a real change in how badly it hurts when one does.
Pair D. A093 issued 19,450 tickets at a measured 59 km/h, the eighth highest ticket volume of any site in the programme; A018 issued 6,640 on a 34 km/h residential street. Despite that gulf in speed and enforcement volume, both produced a similarly modest result, crash counts down 5 and 9 percent, injury share down less than 2 points, changes within the range of ordinary year-to-year variation.
What ties the four pairs together is what does not distinguish them. Each pair spans some of the widest demographic gaps in the network, in income, home ownership, visible-minority share or commute mode, and each pair still lands in the same quadrant. That is the site-level version of the finding in the equity section above: camera outcomes track road conditions and collision mix, not who lives nearby.